
Introduction
This metric started as a simple question: are my highest earners actually giving me the most value?
A straight comparison of wages and average ratings rarely tells the full story. Availability matters. So does sustained contribution over time. That’s where a calculated Player Value Index (PVI) can bring to life the underlying numbers in your squad in interesting or useful ways. So I created one, for a bit of fun.

Methodology
- Weighted rating contribution = average rating × minutes played
- A light performance adjustment is then applied (roughly +0.5% per goal or assist and +0.25% per clear-cut chance). The modifiers are intentionally small and somewhat arbitrary. They’re designed only to separate players with similar ratings and minutes, not drive the metric itself.
- Player share of squad contribution = adjusted total ÷ squad total
- Wage share = player’s weekly wage ÷ total weekly wage bill
- Value Index = contribution share ÷ wage share
1.00 = output share matches wage share. Above ~1.2 is a bargain; below ~0.8 is expensive relative to performance output.
What does the metric actually tell us?
The Player Value Index is not trying to identify the best player in the squad.
It’s trying to identify the players who are providing the greatest return on the club’s wage investment.
I.E. A left-back contributing 6% of the team’s weighted performance while consuming only 4% of the wage bill is helping the club outperform its spending. Conversely, a high-profile player taking 10% of wages while contributing only 3% of overall performance is effectively reducing the efficiency of the squad.

Which decisions can it inform?
The most obvious application is contract management.
Players consistently generating a Player Value Index above 1.20 in the example used in this article are candidates for improved contracts. They’re producing more than you’re paying for and may soon expect recognition of that value.
At the other end of the scale, players significantly below 0.80 warrant investigation. That doesn’t automatically mean they should be sold; age, injuries, leadership and future potential still matter. What it does mean is that the club is currently receiving less on-pitch contribution than their salary would suggest.
The metric can support:
- Contract renewal decisions
- Squad trimming
- Recruitment planning
- Wage budget allocation
- Identifying hidden squad heroes
- Identifying expensive passengers
An example
In my current Rangers save, I’ve used the FM View Exporter (linked here) to capture the current statistical output of my team, including their weekly wages.

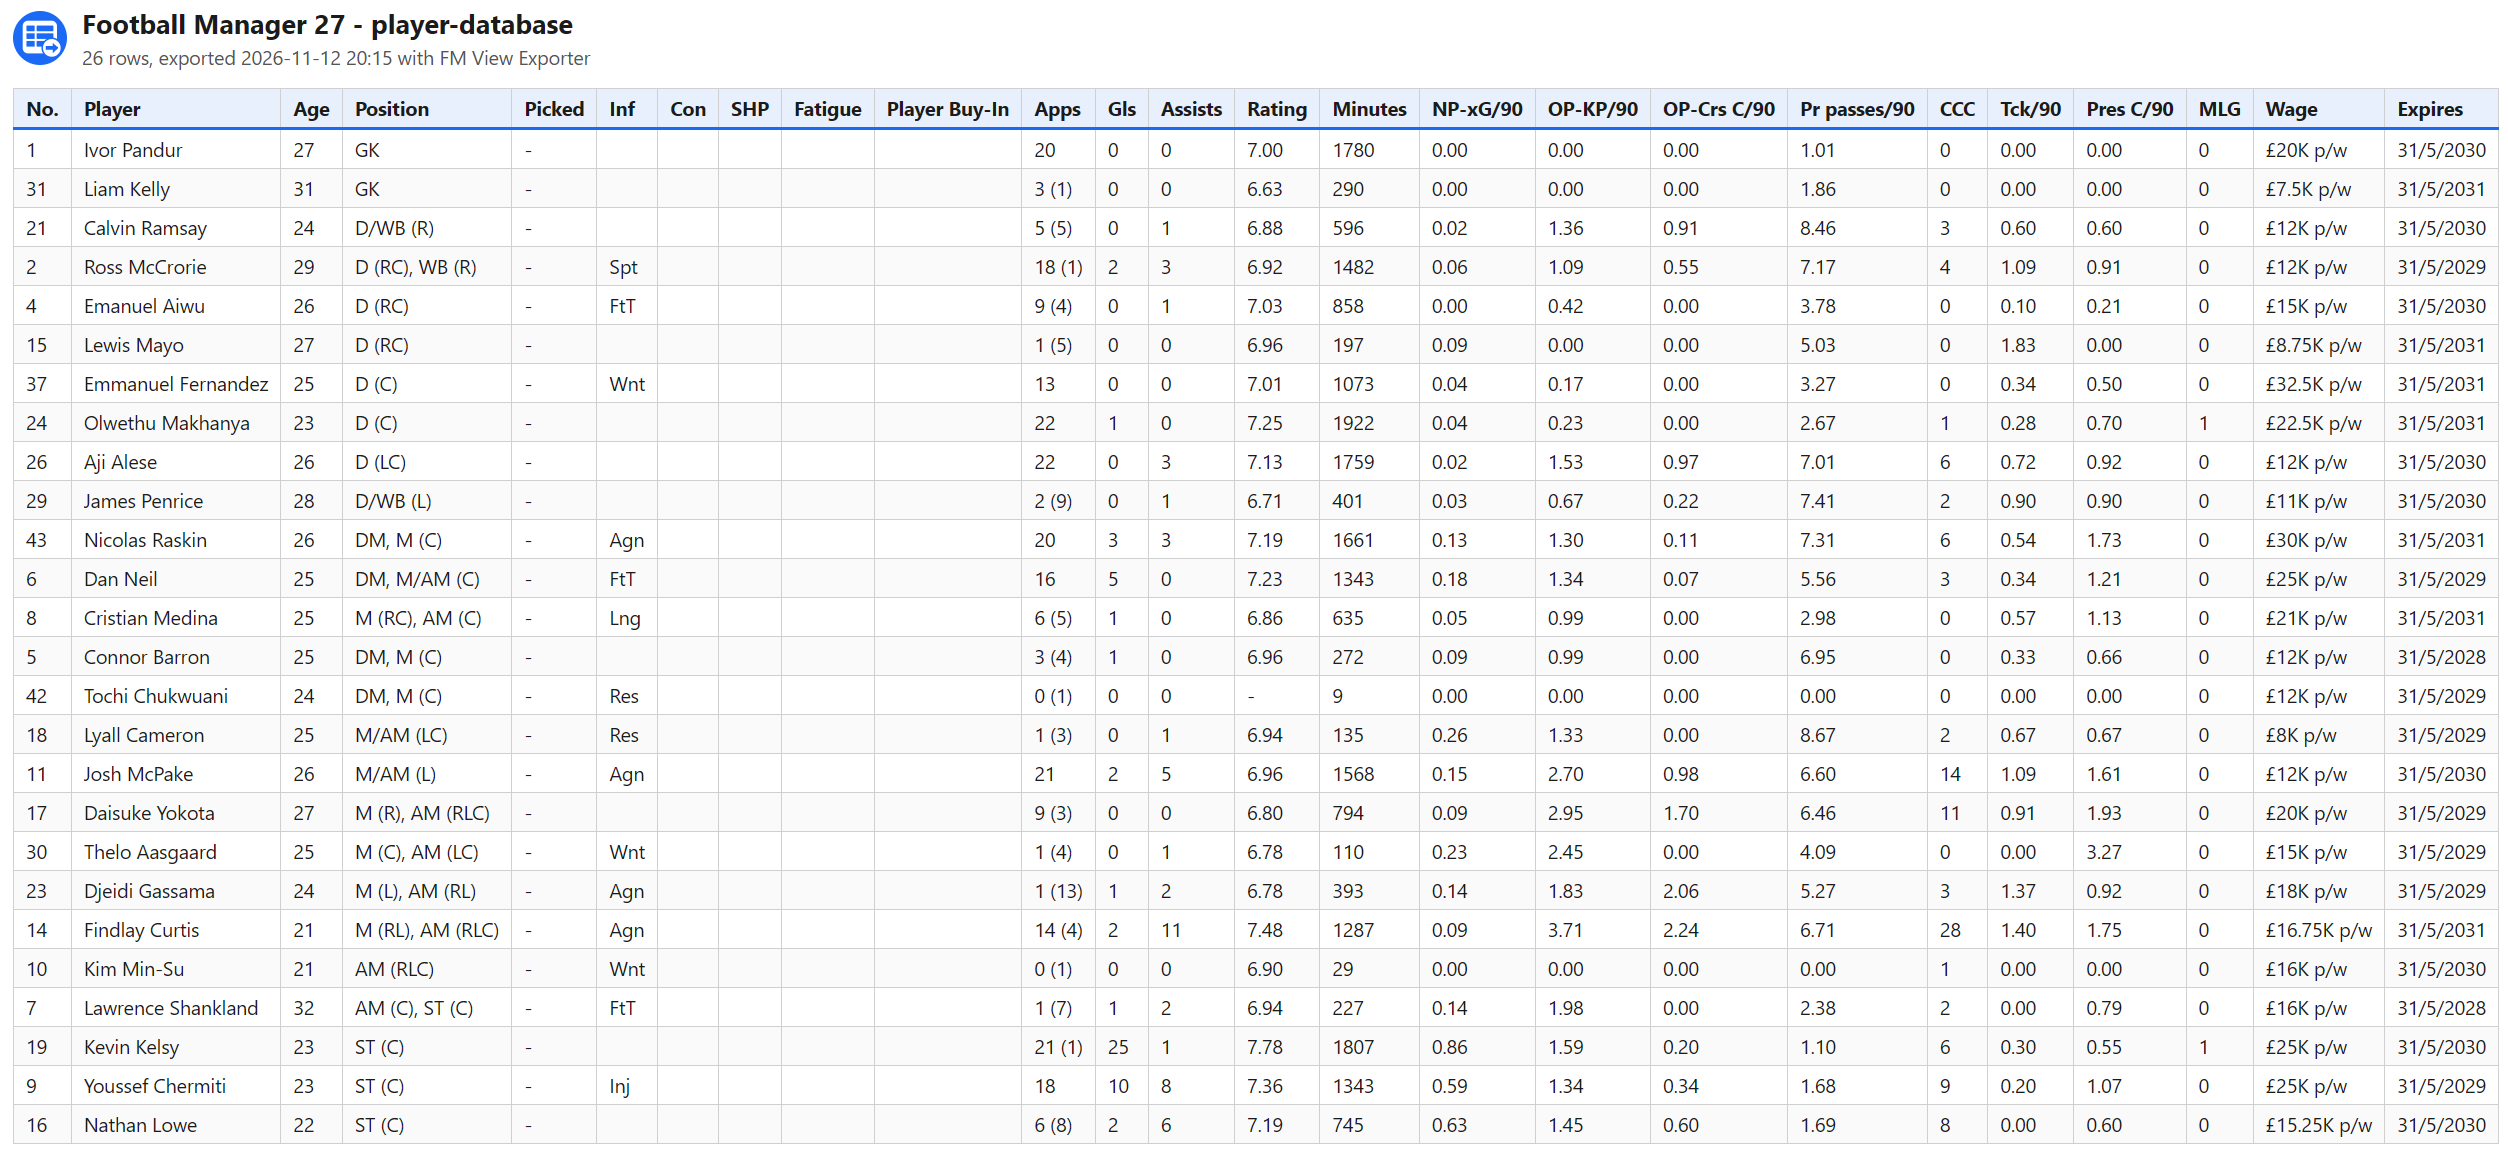
Now I have the data, it’s time to crunch some numbers and land on some Player Value Index numbers for our current first team squad.
It’s the 27/28 season, so I’m going to start the wage calculation from 1 July 2027 just as pre-season started, capturing that the date in-game is 20 October 2027.
Here are the results:
Biggest Bargains
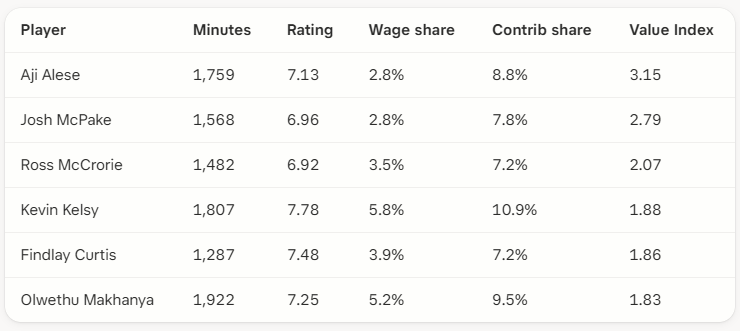
Alese and McPake are the clearest wins: both on £12k, both with heavy minutes, and both with enough end product to push the index well above 2.5. Makhanya’s 7.25 rating across nearly 2,000 minutes is also excellent value. Kelsy’s goals keep even a £25k wage looking reasonable.

Roughly Fair Value

Raskin is the interesting case. His £30k wage is among the highest, yet 1,661 minutes at 7.19 plus three goals and three assists keeps him on the right side of fair. Chermiti and Neil are almost perfectly priced for the minutes and ratings they have produced.
Most Overpaid relative to Contribution
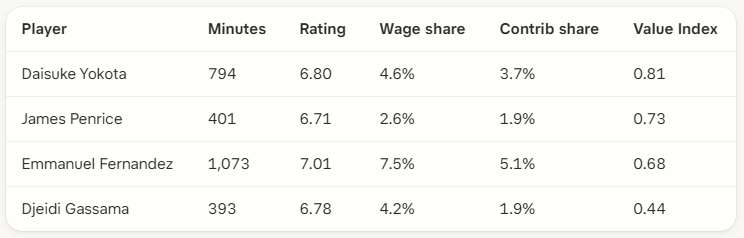
Fernandez remains the clearest outlier. A £32,500 weekly wage is the highest in the squad, yet his contribution share is only 5.1%. The rating is solid and the minutes respectable, but the index does not see quite enough output to justify the huge salary. Yokota and Gassama are lighter cases: both are paid as if they were more regular than they have been so far. Penrice’s limited minutes have simply not given him the chance to repay the £11k a week.
Unexpected Takeaways
The pattern is consistent. The mid-salary players who have been trusted with heavy minutes (Alese, McPake, McCrorie) look like the best value in the building. The top end of the wage bill is not disastrous, but Fernandez is the clearest candidate for a hard conversation if the contribution numbers do not improve. Yokota looks like a simple decision to sell. He is 27-years old, taking up almost 5% of the wage bill but contributing less than 4% of our collective performance rating. Kelsy’s incredible goal return continue to make even a £25k wage look like money well spent. If we removed the four lowest Value Index players, we could save almost £80k from the wage bill a week. That’s money which could be invested in players providing more proven performance output.
The most important caveat
The Player Value Index is a squad-building tool, not a player-quality tool.
An elite star can still represent tremendous value despite earning huge wages if they carry a similarly huge share of the team’s performance. Likewise, a prospect on minimal wages may rank highly simply because their wage share is tiny.
The real power of the metric is comparative. It reveals how efficiently your wage budget is being converted into on-pitch contribution and highlights where the balance of investment and performance is working, or where it isn’t.
In a game where every pound of the wage budget matters, analysis like this could uncover where the real value in your squad is and where there’s wasted budget.
What’s next?
My aim is to turn the Player Value Index into an interactive tool where you can simply upload an export of your squad’s numbers and see all of your players ranked by their Player Value Index score, to help with your recruitment decisions and strategy. Watch this space.
Thanks for reading,
FM Stag